Update: We originally published this article in 2012 as a quick tip for calculating inventory turnover. The metric remains useful, but the original version used sales revenue in the calculation. This updated guide explains the standard inventory turnover formula, how to interpret the result, and what the number can reveal about an eCommerce business.
Inventory turnover helps a business understand how quickly it sells and replaces inventory during a specific period. A low rate may indicate slow-moving or excess stock. A high rate may reflect strong demand, but it can also mean the business is carrying too little inventory to support sales consistently.
The number becomes most useful when it is reviewed alongside stockouts, supplier lead times, purchasing activity, product margins, and changes in demand.
What Is Inventory Turnover?
Inventory turnover measures how many times a business sells through its average inventory during a month, quarter, or year. For example, an annual turnover rate of six means the business sold and replaced the equivalent of its average inventory about six times during the year.
The metric can be calculated for the entire business, a product category, a warehouse, or an individual SKU. Looking at turnover by product can be especially helpful because one company-wide rate may hide a mix of fast-moving and slow-moving inventory.
Oracle defines inventory turnover as the number of times a company sells and replaces its finished-goods inventory during a particular period.
Inventory Turnover Formula
The standard formula is:
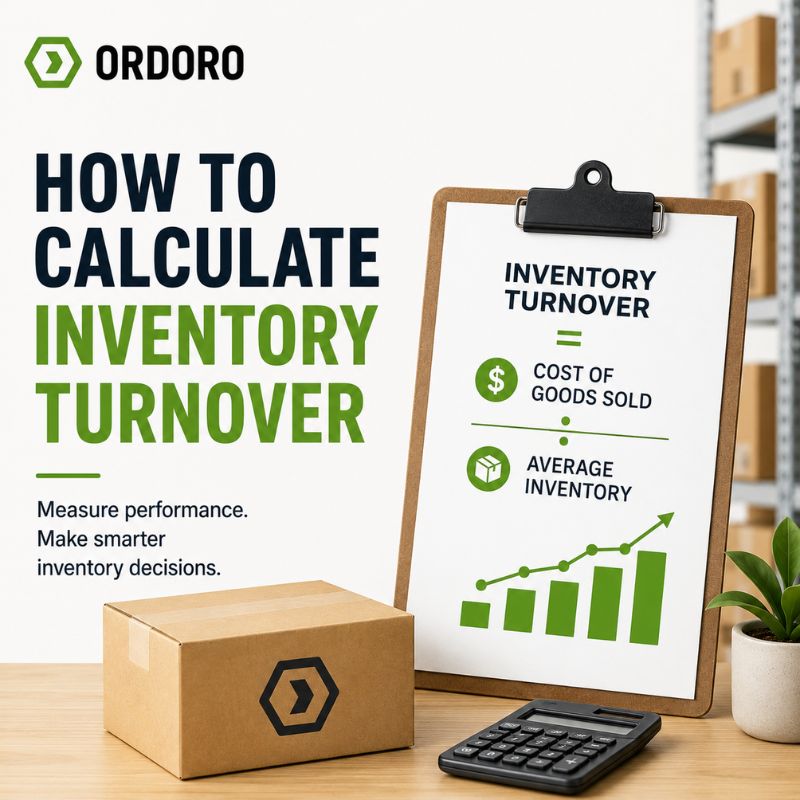
Inventory turnover = Cost of goods sold ÷ Average inventory
Cost of goods sold, often shortened to COGS, represents the direct cost of the products sold during the period.
Average inventory is commonly calculated as:
Average inventory = (Beginning inventory + Ending inventory) ÷ 2
Using COGS instead of sales revenue keeps both parts of the calculation based on product cost. Sales revenue includes the business’s markup, which can make turnover appear higher than it actually is.
Shopify and Oracle both use cost of goods sold divided by average inventory as the standard inventory turnover formula.
Inventory Turnover Example
Suppose an eCommerce business begins the year with $80,000 in inventory and ends the year with $120,000.
Its average inventory would be:
($80,000 + $120,000) ÷ 2 = $100,000
If its cost of goods sold for the year was $500,000, the turnover calculation would be:
$500,000 ÷ $100,000 = 5
The business turned over its average inventory five times during the year.
That result does not automatically mean the business is performing well or poorly. It should be compared with previous periods, similar products, seasonal demand, and the company’s ability to keep important items available.
Why Average Inventory Matters
Using only ending inventory can distort the result when stock levels change significantly during the year. A seasonal merchant may carry much more inventory before the holidays than afterward. A growing business may also end the year with considerably more stock than it held at the beginning.
Averaging beginning and ending inventory helps account for some of that movement. Businesses with large seasonal swings may get a more representative result by averaging monthly or quarterly inventory values instead of relying on only two points.
How to Interpret Inventory Turnover
A higher turnover rate generally means products are selling and being replaced more frequently. That can indicate strong demand, efficient purchasing, lower storage requirements, and less money tied up in slow-moving stock.
However, a high rate can also signal that inventory is too lean. The business may be placing emergency orders, running out of products, or losing sales while waiting for replenishment.
A lower rate means products remain in inventory longer. That may point to excess stock, weaker demand, outdated products, or purchasing that has outpaced sales. Low turnover can increase storage costs, discounting needs, and the amount of cash tied up in inventory.
There is no single healthy rate for every eCommerce business. A grocery seller, apparel company, furniture merchant, and specialty-parts business will naturally have different purchasing cycles, margins, and storage needs.
Instead of relying on one universal benchmark, compare turnover across:
- Similar products or categories
- Previous months, quarters, or years
- Seasonal selling periods
- Warehouses or fulfillment locations
- Products with similar supplier lead times
A change in the rate is often more informative than the number by itself.
Ordoro’s article on inventory inefficiency warning signs explains how slow-moving stock, frequent stockouts, and unreliable quantities may point to broader operational problems.
Inventory Turnover vs. Days Inventory Outstanding
Inventory turnover shows how many times inventory moves through the business during a period. Days inventory outstanding, sometimes called days inventory on hand, estimates how many days the business typically holds inventory before it is sold.
One common annual formula is:
Days inventory outstanding = 365 ÷ Inventory turnover
Using the earlier turnover rate of five:
365 ÷ 5 = 73 days
That means the business held inventory for an average of about 73 days before selling it.
The two metrics describe the same movement from different perspectives. Turnover shows frequency, while days inventory outstanding expresses the result as time.
How Often Should You Review Inventory Turnover?
Many businesses calculate turnover annually for financial reporting, but eCommerce teams may benefit from reviewing it monthly or quarterly.
More frequent reviews can reveal products beginning to slow down, purchasing that is outpacing sales, inventory levels that are becoming too lean, and differences between categories or warehouses.
Avoid reacting too quickly to a short-term change. Promotions, supplier delays, product launches, and seasonal events can temporarily affect the rate. Look for patterns across several periods before making a major purchasing decision.
How Inventory Software Supports the Calculation
Inventory turnover depends on reliable cost, quantity, purchasing, and sales information. When those records are spread across storefronts, spreadsheets, warehouses, and accounting systems, calculating the metric can require significant manual reconciliation.
Connected inventory software can make it easier to track quantities by product and warehouse, purchase orders, received stock, inventory value, adjustments, returns, and sales activity across connected channels. The software does not decide what turnover rate is appropriate, but it can provide more dependable information for calculating and interpreting it.
Ordoro’s inventory management tools help merchants track stock, manage purchasing and receiving, support multiple warehouses, and keep inventory connected with order activity.
Businesses can also review Ordoro’s partners and integrations to see which sales channels and business systems can connect.
For more guidance on selecting a platform, read our guide to inventory management software for eCommerce.
Improving Inventory Turnover
Improving turnover does not mean making the number as high as possible. The goal is to keep enough inventory to support demand without carrying unnecessary stock. A business may improve its inventory position by adjusting purchase quantities, reviewing reorder points, reducing orders for slow-moving products, bundling excess stock, or improving demand planning.
Accurate receiving, dependable SKUs, regular cycle counts, and clearly assigned inventory ownership also matter. Turnover calculations are less useful when the underlying quantities and costs cannot be trusted.
Our guide to inventory management best practices explains how receiving, purchasing, storage, counting, and connected systems support better inventory decisions.
Inventory Turnover FAQs
Should inventory turnover use sales or cost of goods sold?
Use cost of goods sold divided by average inventory. COGS and inventory are both valued at cost, making the calculation more consistent.
Is a high inventory turnover rate always good?
No. It can indicate strong sales and efficient purchasing, but it may also mean the business is carrying too little stock and losing sales to stockouts.
Can inventory turnover be calculated for one product?
Yes. Calculating turnover by SKU or category can reveal fast-moving and slow-moving products that may be hidden within a company-wide average.
Turn Inventory Data Into Better Decisions
Inventory turnover can help merchants understand how quickly products sell, where cash may be tied up, and whether purchasing is keeping pace with demand. Ordoro helps eCommerce businesses track inventory, manage purchase orders and receiving, support multiple warehouses, and keep stock connected with orders and fulfillment.
Ready to see how Ordoro brings those workflows together? See How Ordoro Works