A successful marketing strategy is all about targeting the right audience. When you know which customers are worth most to your business, what products they’re most likely to buy, and how much they’re likely to spend, you know everything you need to build a winning business strategy.
And a lot of the data to do it is already in your hands. You already have audience data that will show you your best customers and how to market to them successfully. You just have to use it.
First you have to find it. Then, the secret is to look for patterns – connections, where several key metrics come together to define the core customers who are carrying your company. Typically about 1% of your customers are responsible for 40% of your revenue. That’s the audience you want to target.
Let’s get started by figuring out who your customers and visitors are. Learn their basic demographic data, and figure out where they’re from. Then you can use that information along with vital purchase metrics to identify your best customers.
Demographic Data
Demographic data is simple information on who your audience is. What age group do your visitors belong to? What’s their gender, ethnicity, education level? Finding these kinds of things out can be the first steps towards creating a realistic persona for that audience segment.
In some cases, you’ll have this data already on hand. That’s often true if you have good email outreach, for instance. But if you don’t, it’s not that hard to get. Here are some killer sources of demographic data:
Google Analytics
Google Analytics is a great source of basic demographic data.
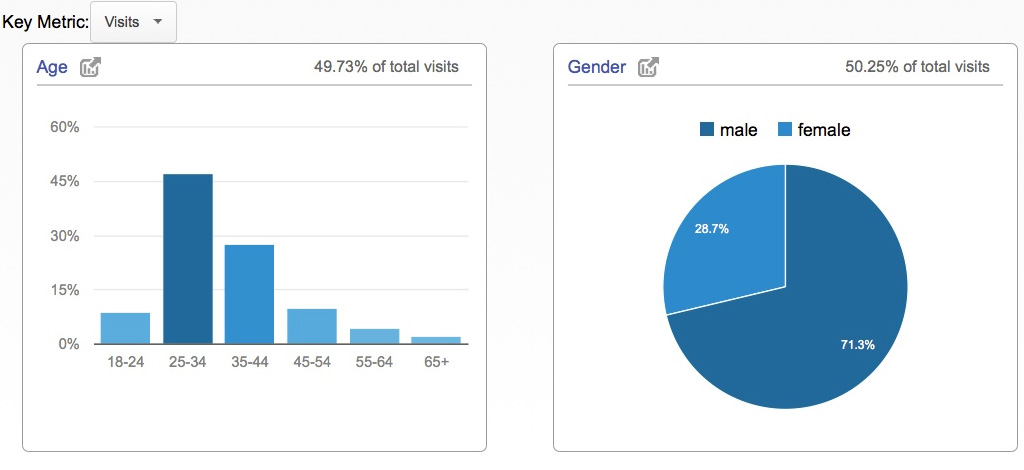
You have to set up Google Analytics to capture and display this information, but once it’s up and running you’ll see age, gender, and other basic demographic data on your visitors in GA.
Signup Forms
Signup forms are basic to e-commerce. Yeah, you shouldn’t insist on creating an account, but you should hope to get your customers to sign up sooner or later, and when they do it’s tempting to just ask them this stuff in the sign-up form.
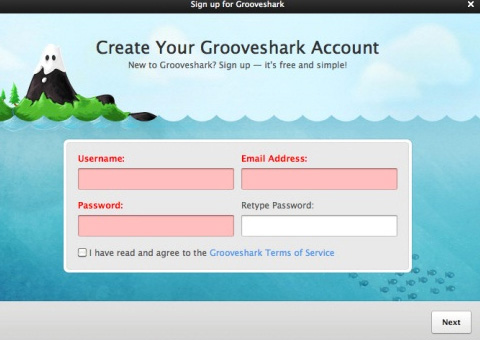
Trouble is, if your sign-up form’s too long, they’ll be gone. Super-short forms work best.
So use it sparingly, and consider sending a post-signup questionnaire instead, potentially one that asks about interests but allows you to infer age and gender from it. Lee Childs novels, fishing rods and bourbon? Could be a college girl – but probably not.
Another option is to offer sign-up popups right on product pages, and offer value that’s strongly gendered, aged or otherwise skews demographically.

Just a guess, but that one probably got mostly women.
Inference/Cookies
Cookie profiling uses cookies – encrypted text that identifies that user – placed on people’s computers to track their browsing and draw inferences from it about their age, gender and other demographic data. You can place your own, but most people will get their cookie data from big websites that sell the data as a sideline. It’s not totally reliable – imagine the browsing profile of a mother, father, teenage son and visiting grandparents all sharing the same computer – but it can offer some insights.
Social Signup
Social signup allows users to sign up directly with their social accounts – Google and Facebook are the most common. When someone signs up with their social account they also give you access to their name, age, gender, and a whole pile of other data. Customers hate signup forms, you love data – everyone’s happy!
Once you have that demographic data, use it to ascertain who your best customers are – old or young? College educated or beauty school dropouts? Knowing basic demographic data is the first step to highly accurate audience targeting that will let you deliver relevant service.
Location
E-commerce might be selling worldwide, but your products are often being bought in specific geographic locations. Figure out where they are and you can concentrate your ad and marketing budget on those locations, as well as using that data to improve the relevance of copy, images and messaging.
In particular, paid advertising costs rocket when advertising isn’t closely targeted. Because e-commerce is non-local at one end – your store is as easily accessible from Switzerland as Wisconsin – it’s easy to forget the effect customer location can have on ad budget. And just as your audience is grouped demographically, it’s grouped geographically too. Location is a must-know to build marketing that reaches the right customers, and it belongs in every persona you construct.
You can even use it to alter the time you send messages: if you know most of your customers live in southern California, jokey copy about New York winters won’t resonate with them, and it’s probably a good idea to set your email schedule to Pacific Standard Time. (You can also set your store to offer customers prices in the right currency.)
How do you find location data?
IP Geolocation
An IP address is your ‘internet address.’ Every time you ask your browser to send you data, it gets sent to your IP address. That means your website knows the IP addresses of all your visitors. Add in a database that links IP addresses to physical addresses and you can locate someone, at least close enough to use that data to offer them better content or more useful deals or products.
Google Analytics
In the Demographics section, under Audience, you’ll find a Location report in GA that tells you where visitors are located.
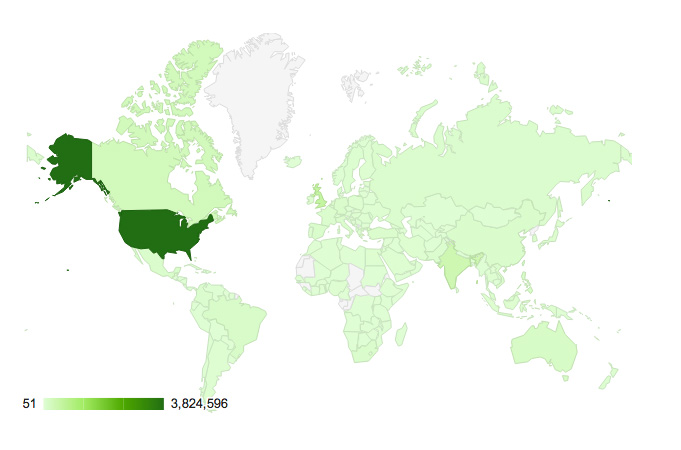
There are some weaknesses here – the service uses IP location so it will misplace people using virtual private networks, and at the City level of accuracy it’s known to place people in the wrong city. But it gives you location data that’s at least as good as any homebrew IP tracker and will automatically integrate it into other GA reports.
Purchase Behavior
Figuring out customer purchase behavior is the final piece of the puzzle. What did they buy, how and when? Throw all this data together and you’re close to a view of Customer Lifetime Value (CLV) – how much each customer is worth to your business.
Average Purchase Amount
What is your average order value (AOV) across your store? What about your best customers? Typically, your best customers don’t just come back more and make more purchases; they also spend far more.
Once you have identified top spend per purchase, compare it with your customer data. For instance, location – do people who live in Oregon spend more or less than people who live in Minnesota? What about age, gender, ethnicity?
Ultimately, what you want to discover here is correlations between high AOV and other attributes that can be used to predict it, so you can nurture those customers and encourage them to purchase, driving up revenue.
Which customers spend large amounts infrequently? Which spend smaller sums but more often? And can this be compared to lifetime customer value to reveal which customers are worth most to your business?
Frequency of Purchase
Another key purchase metric is order frequency. Who’s the best customer – someone who spends $35 at every purchase, or someone who spends $70? Simple – until you factor order frequency in. If the $35 customer buys every month and the $70 customer every year, that picture looks a little different.
You can also use this data to realign your marketing strategy – for instance, if your best customers really do buy monthly, you can build your marketing on a cyclical purchase model, with reminder emails and maybe even paid membership offering discounts.
‘The lifetime value of each customer over a certain period of time and from a specific traffic source is key. You could build campaigns to sell one product to one person one time. But how do you build out a marketing plan that continues to engage both past and present customers and drive demand for both present and future products?’
– Rob Emrich, PaeDae
Product and Product Category
You’ll probably sell more of certain product categories than others. This is quite dependent on your industry – if you sell clothes, you’ll probably move the majority of your swimwear in the summer and most of your boots and coats a little later in the year. The same store might see demographic splits too: most of your skinny jeans will sell to folks under 40, for instance.
That might be obvious in the garment space, but whatever your store sells, you’re going to have product categories that outsell others. And within that you’ll have star selling products that outsell their categories.
For some store owners this can be the beginning of a journey to find out where your store actually makes its money; it’s not unusual to find out that some of your products cost you money, you break even on most of them and that your actual ‘business’ – the part that makes a profit and pays for all the rest – actually only sells a handful of items.
How Did You Get Them?
Now you know who your customers are. The next step is to figure out how they found you. Did they click through from social media? Were they searching and you came up? Were they on mobile or desktop at the time? And what made them take the plunge and visit your store?
Content Consumed
One key question to ask is, what content are your customers consuming?
You need to know:
- What content is consumed before a first visit?
- What content is consumed before a visit that results in a purchase?
- What content is consumed on your website?
When you know that, you can align your content strategy to the process that your best customers follow. For example, if your best customers watch a how-to video on Youtube, then come to your site via a link in the video and buy right then and there, it’s time to make a few more videos. If your best customers prefer to download PDF guides or read blog posts, again, you know what to do.
It’s important to remember that interactions that don’t result in a conversion aren’t valueless. For example, you might have members who click through from your email newsletter every time they get it, read a couple of blog posts and don’t buy anything. If they’re also among your top customers, should you stop sending them the newsletter because it ‘doesn’t convert’? No – that’s crazy. It’s obviously pleasing them, so instead you should look at what newsletter content gets clicked by your top customers and reorient your newsletter to their interests.
Traffic Sources
Traffic source can tell you a lot about your customers. Knowing which traffic source is delivering most customers lets you resegment your marketing efforts by channel.
Visit your Google Analytics dashboard and check out customer data by Source to ascertain exactly which customers are coming via which channels.
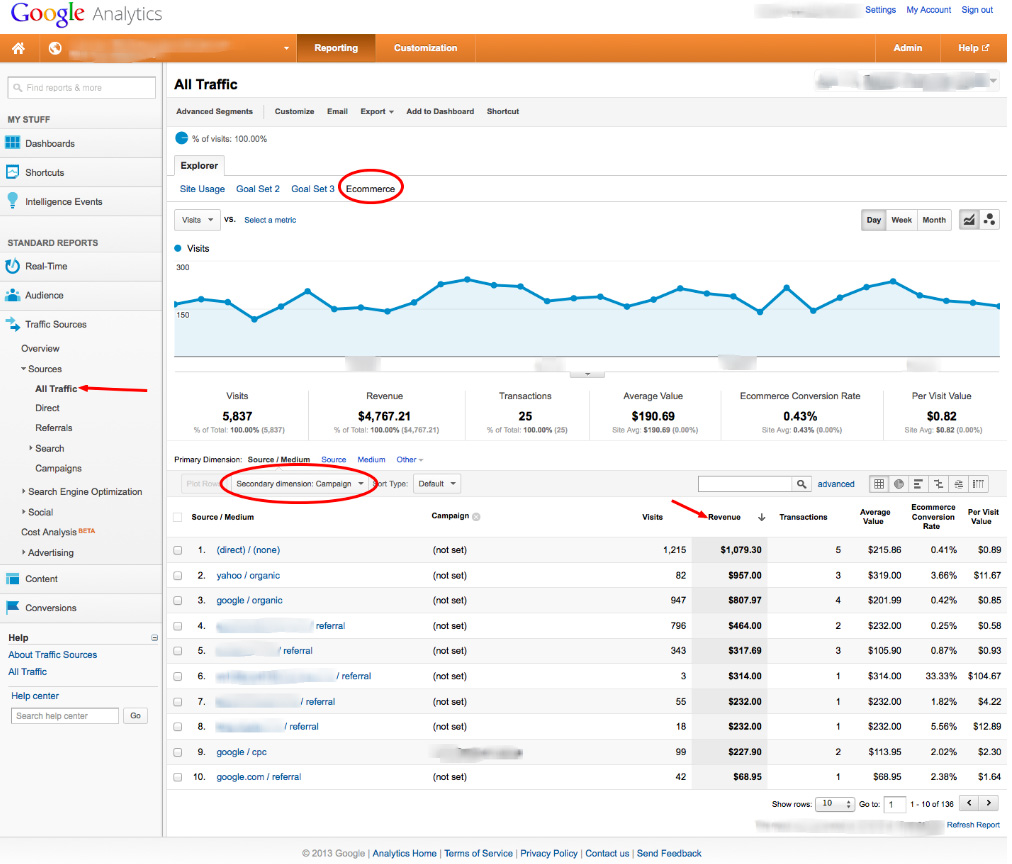
You can track revenue against traffic source too. It’s not uncommon to find that some channels are better at producing certain ‘levels’ of customers: for instance, social media tends to produce more customers with lower AOV. Email and search are usually responsible for both the most traffic and the best-paying customers. Your mileage may vary, though.
It’s also common to find that different channels are driving different ages or genders of customers to you. A strong Pinterest presence will tend to garner more female customers, for instance, because the channel itself skews female.
How do you set this in motion? Assuming you already have Google Analytics up and running, set up e-commerce Tracking and enable e-commerce Tracking in your e-commerce tool – it’s the Google Analytics tabs in Bigcommerce and Magento. Woocommerce requires you to navigate to Integrations, enter your GA account ID number and check the ‘Add eCommerce tracking code to the thankyou page’ box.
Some e-commerce tools – WP OPenCart, for example – don’t provide native support for GA. If that’s the case, a third party plugin is your best choice unless you’re a developer because coding for this is tricky.
Once you’ve done all that, wait at least 24 hours and check if transactions show in GA.
Device
Etail is becoming mtail. Most e-commerce stores have a native app and many user journeys that end on laptops and desktops get started on mobile.
Segment your customers by device, then contrast with other metrics. Are mobile users making fewer purchases but spending more money when they do? What about location and demographics?
It’s when you put all this customer data together that you can segment and flesh out your best customers. It could be, for instance, that your best customers are women aged 55-65, resident in Orange County and buying on tablets. Knowing all that lets you offer a whole new level of targeting to those customers.
You can send emails optimized for mobile that acknowledge local events. You can even seek partnerships with local bricks and mortar stores. Knowing what direction to take all starts with having this detailed, accurate and actionable data about your customers.
The results can be surprising: Andrew Saladino of Just Bath Vanities says, ‘my company creates a monthly report based on mobile usage, and we were stunned to learn that approximately 20 percent of our users view our website on a mobile device.’
Even leaving all that aside for a moment, finding out how many of your customers start a purchase process on mobile might be the thing that convinces you to finally optimize your site – and especially your checkout – for the fastest-growing channel.
‘We’re tracking visitors from 31 different screen sizes on our site,’ says Sid Bharath, ‘and that’s for mobile phones alone! Then, there’s different versions of devices and operating systems.’
You can find data on device usage in Google Analytics under the Audience tab: scroll down and you’ll see options for mobile, and under it, Devices. GA will show you Desktop, Tablet and Mobile data.
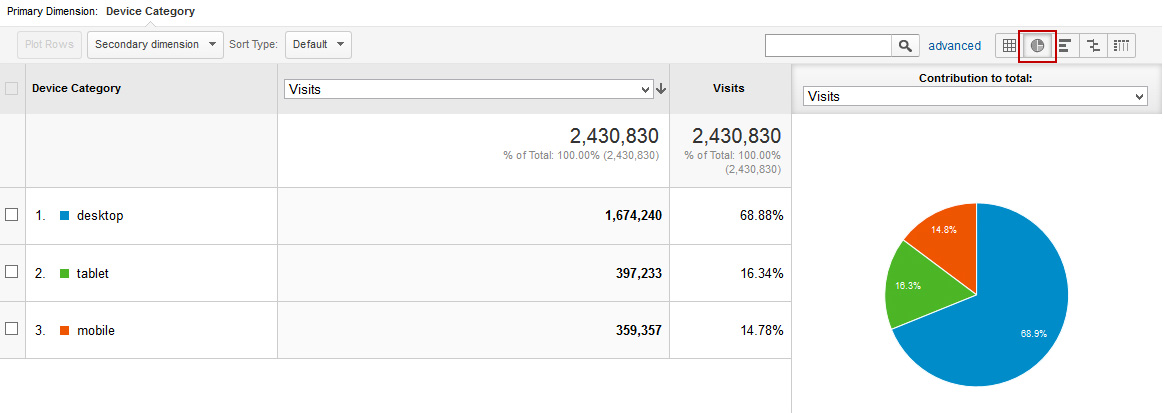
If you’re not seeing it, you might need to set up the report first.
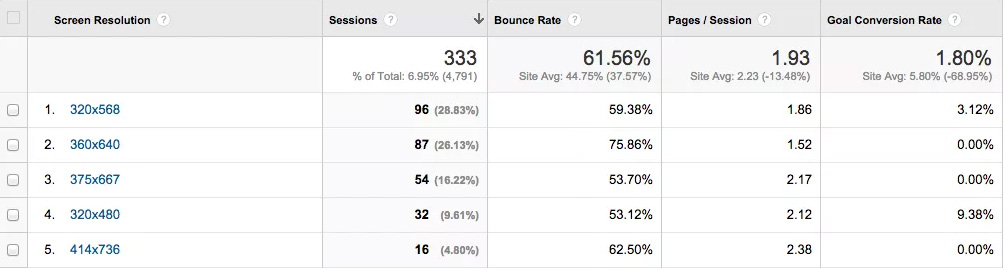
GA will also show you sessions grouped by screen size, letting you identify device sizes that aren’t being served well – or that convert disproportionately well.
Conclusion
The data you gather on your customers can deliver critical insights into which customer groups are most desirable for your business. Using demographic and purchase pattern data together you can identify traits your best customers have in common, then nurture similar customers. You’re also better placed to serve the customers you already have. Delivering relevance to customers old and new is the key to e-commerce success: leverage your data to get there.
About The Author:
Richard Bayston is a freelance blogger and copywriter covering tech, digital marketing and content strategy for SMBs. I’ve also been known to write on health and fitness. Find out more: Richard@RBCopywriting.com or @RBCopywriting. The rest of my time is spent arguing amicably with my wife and Googling the answers.
*Featured Image Source