Business growth comes from making data-backed choices and monitoring the results. Otherwise you’re flying blind. Trouble is, while everyone knows that, most of us aren’t looking at the right numbers. Many of us default to easily-accessible vanity metrics, tracking page-views or other numbers that don’t really tell you where your business is heading. What you need are metrics that let you make decisions, and then know what effect those decisions had on your bottom line.
Here are the key metrics every e-tailer should be measuring.
Profit Per Visitor
Profit per Visitor measures the contribution each website visitor makes to your bottom line.
Why Does It Matter?
Profit per Visitor puts your traffic acquisition efforts into a recognizable framework and assesses their results. It’s not as precise as some other metrics but it does let you know whether your profit is all that – without knowing Profit per Visitor, high profits or high visitor numbers can both look good. Essentially by tracking profit per visitor you’re getting a look at your margins.
How Do I Track Profit Per Visitor?
Track Users in Google Analytics to come up with the number of visitors, rather than the number of visits.
Track profit using your e-commerce platform. Then take monthly numbers and divide:
Profit/Visitors = Profit per Visitor
Segmented Conversion Rate
Conversion rate is a really obvious metric. It’s also a really important one. But by itself, it doesn’t tell you very much that you can use right now. By comparison, segmented conversion rate can tell you:
- What traffic sources (search, ads, social) are generating conversions
- What devices are generating conversions
- What demographics are converting
- Which browser users are converting
Why Does It Matter?
Again, this is partly useful for figuring out ROI from paid traffic. If you’re acquiring paid traffic from PPC and banner ads, but none of your banner ads is producing converting traffic, then your banner ads need rethinking – or ditching. Without segmenting out more and less profitable visitors, you can wind up paying out for traffic with an average 2.5% conversion rate – because the average is getting pulled up by high performing visitors who are repeat customers, email signups, etc. Low performing traffic could convert much lower and get hidden in the statistics, so your ad campaigns generate an average 2.5% conversion rate – and still lose money.
It’s also useful for technical troubleshooting. Say you spot that your Google Chrome conversions are solid but your Opera conversions are really low. Maybe the kind of person who uses Opera just doesn’t want to buy from you. But maybe there’s some technical glitch, like images not displaying properly or even site crashes, that’s turning Opera visitors away. Spend a half-hour fixing that, equalize your conversion rate across browsers, and you’d see a sharp increase in profitability.
Device checking is really important. Web pages can be displayed on literally dozens of different size and shape screens, so making sure your e-commerce site works across devices is really important. Checking conversion by device lets you see if your site works – not by some arbitrary standard but by the only one that counts: does it work well enough to convert?
How Do I Track Segmented Conversion Rate?
Different segments need to be tracked differently. Segmented conversion rate is kind of a small family of metrics, rather than just one. For tracking by browser, Peep Laja at Conversion XL recommends tracking using Motion Charts, which he says ‘visually help segment data much better than the standard charting in Google Analytics.’ You can activate these by clicking Visualize at the top of many GA reports.
Chart conversions over time by browser, and you can see:
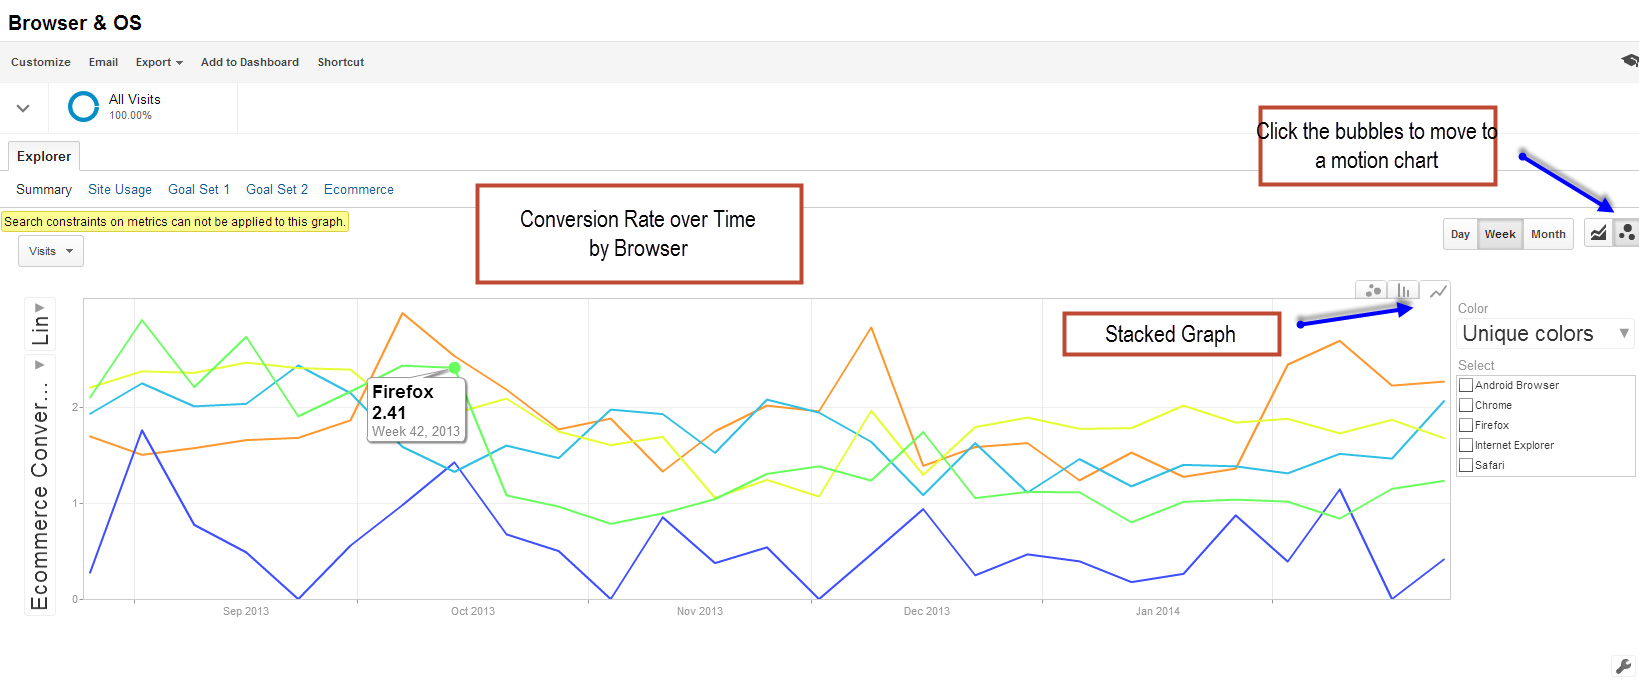
Firefox isn’t just low: it plummets in October 2013. Segment it out and you can identify exactly when:
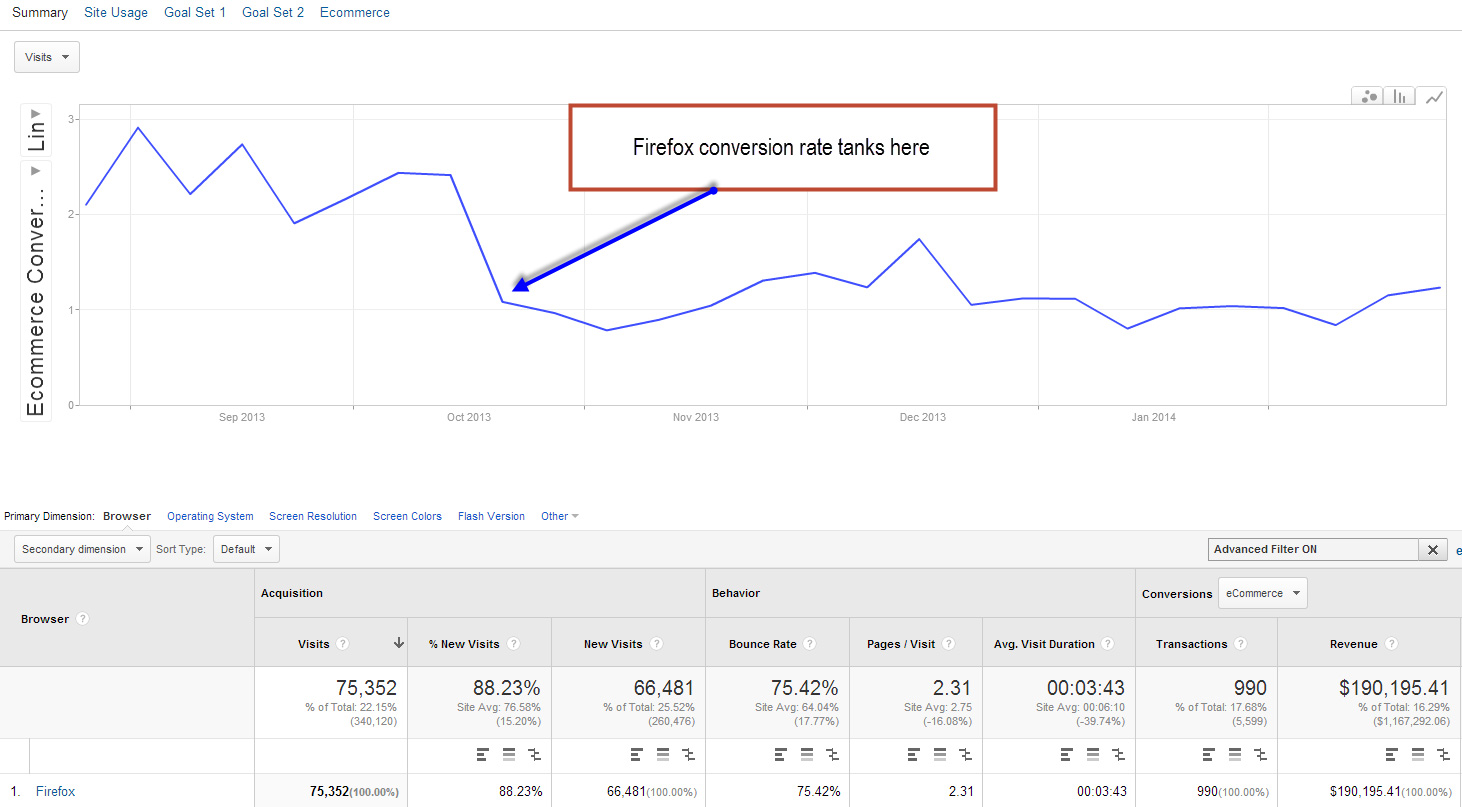
That lets you isolate the event and ask, what happened in October 2013? Maybe everyone suddenly stopped using Firefox, but more likely it’s a compatibility issue of some kind that can be tracked and fixed to put a big step in conversions. Without segmented conversion tracking you’d never have found it.
Conversion Rate by Product
Conversion Rate By Product shows you how many people viewed a product page, then went ahead and purchased the product.
Why Does It Matter?
If you sell about six things, conversion rate by product is less important. But for many e-commerce stores with a lot of products and a lot of pages, conversion rate by product can offer genuinely unexpected insights into what it is that your business actually does. You might find out that actually, in terms of what generated your profit, you only have about six items too. And they might not be the ones you were expecting.
There’s more, though.
Most e-commerce stores generate the majority of their traffic from some form of search, and the majority of that traffic goes directly to a product page. So you have someone who searched for ‘bolt cutters,’ clicked through to your ‘bolt cutters’ page and didn’t buy any bolt cutters from you.
Why not?
Was it poor internal linking? Maybe they were looking for pocket bolt cutters and your industrial bolt cutters page doesn’t link out to other products in the same category, or if it does, users can’t find the link.
Was it poor keywording – were they looking for the song ‘Bolt Cutterz’? Maybe the page is poorly constructed? There’s a million different potential reasons – but figuring out what they are starts with picking up on low product conversions in the first place.
How Do I Track Conversion Rate by Product?
You can track conversion rate by product in Google Analytics, using Event Tracking. Here’s the syntax you’ll need:
pageTracker._trackEvent
(“uniqueproductname”,
“variantname”,
“uniqecategoryname ”,
1)
Make sure it’s working on all your pages and you should get back something like this:
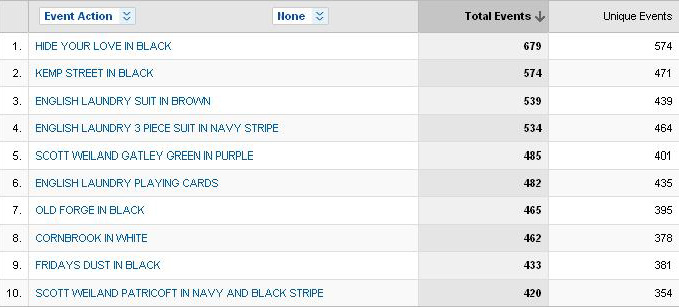
That lets you identify conversion events happening on single products.
Gross Profit Per Visitor
Gross Profit Margin is how much money your business makes on sales. Say you buy a product for $10 and sell it for $20. Gross profit? $10 – 50%.
Why Does It Matter?
Gross margin makes sense as a metric because it shows you how sales relate to profit. Across the board, raised gross profit margins can drive up total profits even while traffic, conversions, sales and so forth remain constant.
It’s a key indicator of business performance. One of the most striking differences between e-commerce businesses that become airborne and those that don’t is margins: e-tailers that get to low 6 figures profits and sit there forever typically have gross profit margins around 30% or less. E-commerce businesses that have 7-figure profits have higher margins – 40% or more.
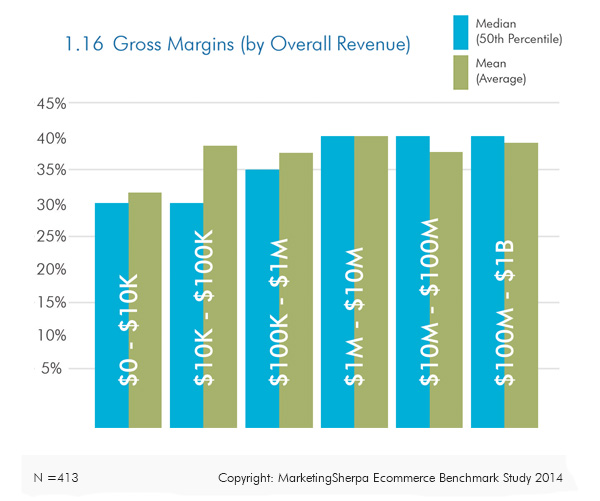
Rather than track revenue, which just doesn’t tell you enough to base decisions on, tracking gross profit margins lets you assess the performance of new products, for instance.
Gross profit per visitor lets you see what your average visitor is worth.
How Do I Track Gross Profit Margin?
Calculate gross profit by subtracting costs of goods – not total running costs – from revenue.
Revenue by Traffic Source
Measure the amount of revenue that traffic from specific sources generates. For instance, it’s common for the occasional blog post to generate crazy traffic. Does that mean you should do a bunch more like that one – or did all those people click through for the timely but irrelevant news reference, then click away, never to return?
Why Does It Matter?
Tracking revenue by traffic source reveals the value of traffic. After all, just getting a bunch of people to look at your website isn’t the name of the game. It’s easy to get whomped by having a bunch of people come and view a page because it sounds like something from a new movie. If you sold a turtle wax product aimed at teenagers, you’d be getting a lot of traffic right now; if you sold an iron for men, you’d be getting plenty too. But how relevant would it be for those people? No ninjas, no Robert Downey Jr – they’re basically looking for something else. So traffic rises but revenue by that source doesn’t move.
Tracking revenue per traffic source is also a vital way to track the efficacy of paid search. If your paid search efforts are generating traffic but revenue from that source is low, you could put that money elsewhere and get more bang for your buck. A good example of the deeper level of information that tracking revenue per traffic source provides is social media. It usually generates way more traffic, and more conversions -but the purchase value is usually way lower. So assessing Twitter by traffic or conversions would make you think, ‘let’s throw money at Twitter.’ Assessing it by revenue makes you think again.
How Do I Track Revenue by Traffic Source?
Revenue is logged next to traffic sources in Google Analytics. You’ll find traffic sources in Standard Reporting > Traffic Sources > All Traffic. Select E-commerce and set the secondary dimension to ‘Campaign.’
You should get something that looks like this:
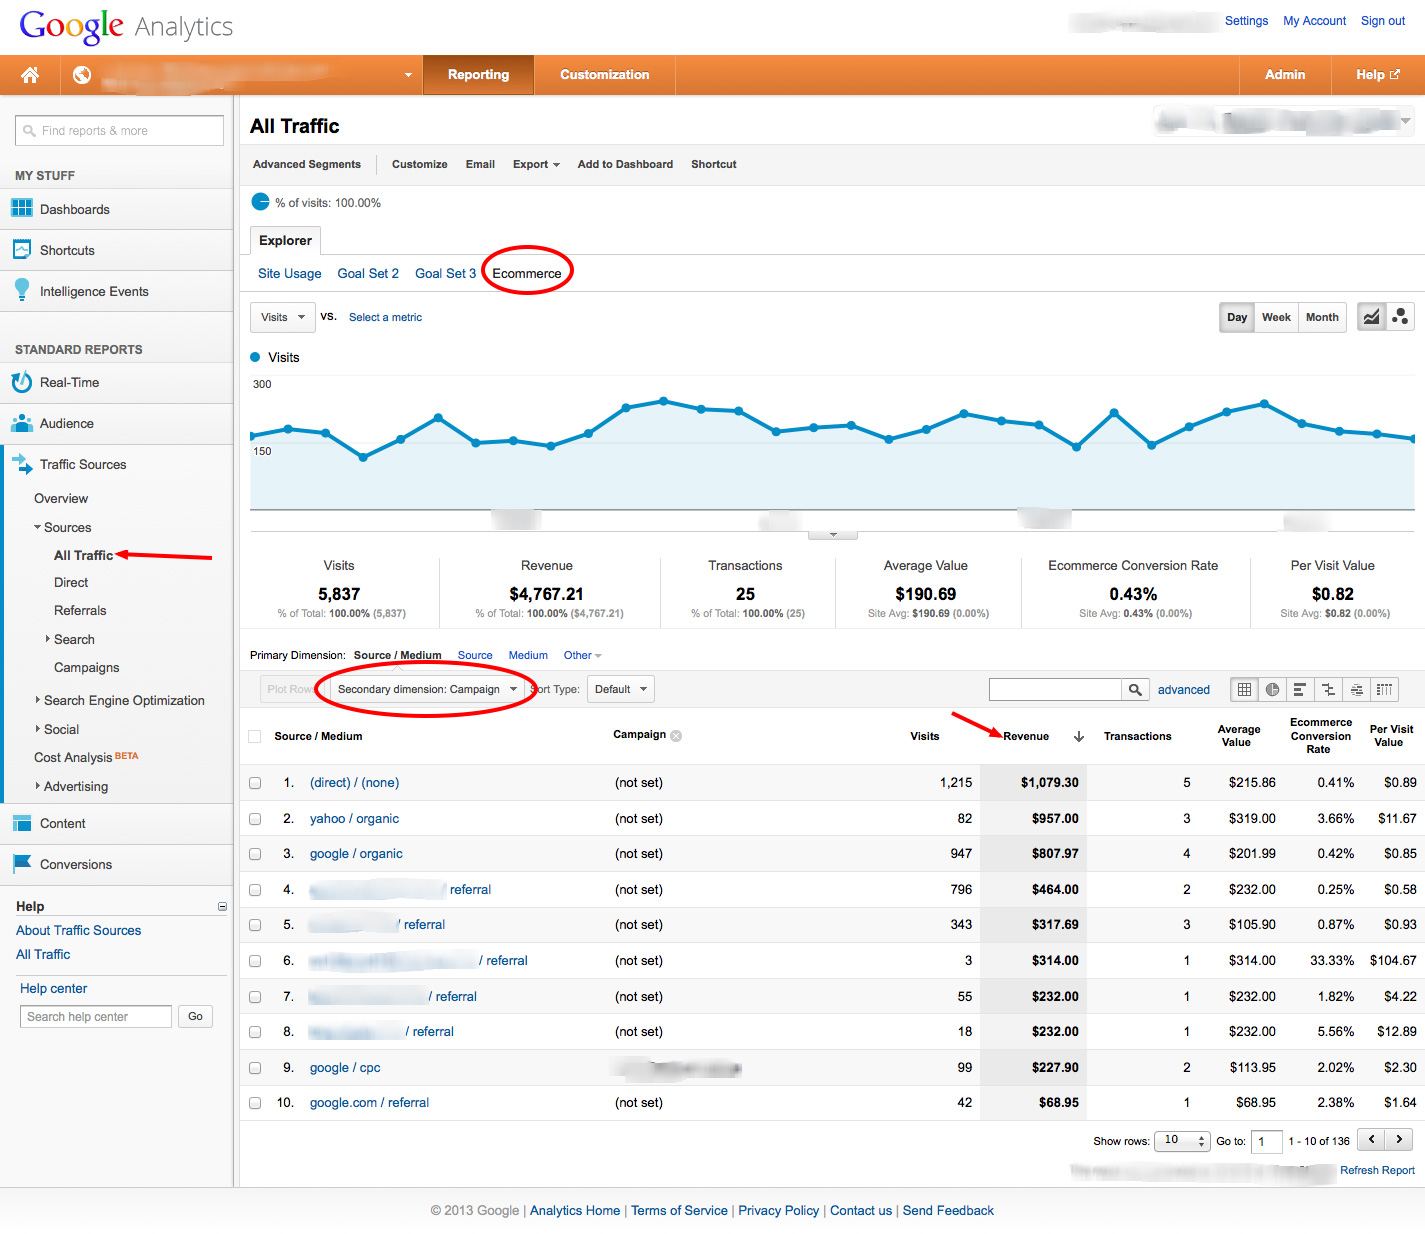
You can also set the secondary dimension to ‘Keywords’ to see which keywords are the most valuable.
Funnel Abandon Rates
Cart abandonment is something everyone in e-commerce knows about. It’s the industry’s biggest cash leak. But in reality cart abandonment starts way before the checkout – people abandon at every stage of the funnel. Tracking and analyzing funnel abandonment rates gives you a much more comprehensive picture.
Why Does It Matter?
Cart abandonment represents the last chance people have to drop out of the purchase process before they actually buy. Maybe that’s why it has such a strong hold over the way we look at abandonment. There’s a sense of, ‘so near – and yet so far,’ about cart abandonment. But looking back through the whole funnel, it makes sense to figure out ‘nonconversions’ – the steps people just didn’t take. We all know that shopping carts are where e-commerce leaks dollars, but how much of that is because it’s easier to track abandoned carts than to put together a coherent picture of a funnel showing where individuals dropped out at each stage and identify how many potential sales are being lost because of poor funnel design, weak UX, crummy conversion rate optimization or irrelevant traffic?
How Do I Track Funnel Abandon Rates?
The most comprehensive way is to track the whole funnel in Google Analytics. Set up a Goal in Admin > Goals, then set up a goal.
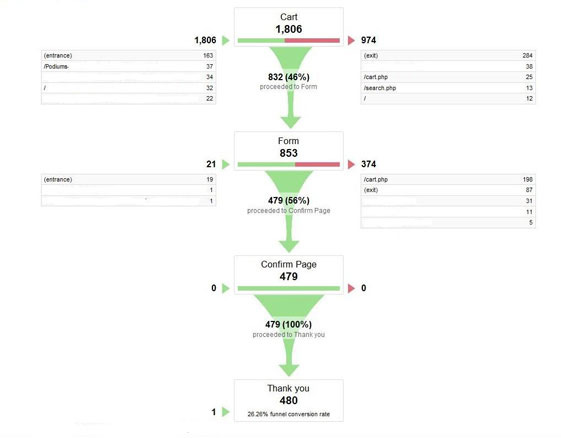
From here you can set up a funnel, identify conversion points along it and gain meaningful insight into where your process is leaking potential profit.
Customer Return Rate
How many of your customers are returning customers, and how many are new? A business that doesn’t attract any new customers might well have a problem – but a business that has no returning customers arguably has a worse one.
Why Does It Matter?
The most important and valuable customers you can have are the ones that come back… and come back. Return customers are worth way more. Repeat return customers disproportionately affect your bottom line. They spend up to 5X more:

And they’re x2 more likely to purchase:
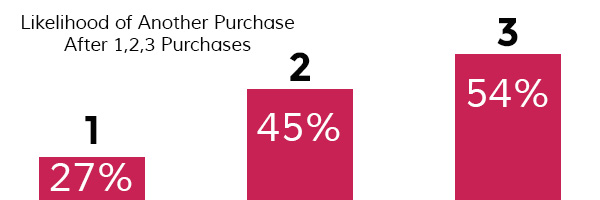
In total, your best customers can be worth up to 18 times your normal customers:
Harvard Business Review showed in 2007 that businesses that focussed their marketing on repeat customers saw ROI of 15X in some cases – around 3X more than the 4X to 6X ROI obtained by campaigns that focus on new customers.
So tracking how many repeat customers you have is a good way to have a gauge on your business’ solidity.
It’s also an effective way to understand how effective retargeting and re-engagement efforts have been. While it doesn’t give you clarity on exactly which method has been effective, it does let you measure a month where you went all-out to get dormant customers to return against one where you didn’t and see if there’s a difference.
How Do I Track Customer Return Rate?
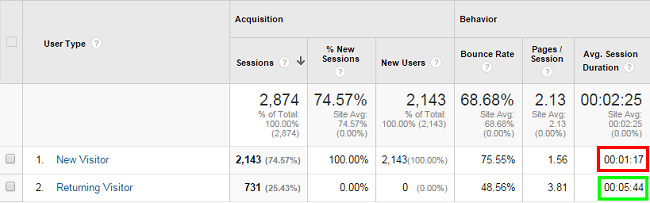
Google Analytics doesn’t offer a clear way to see returning customers.
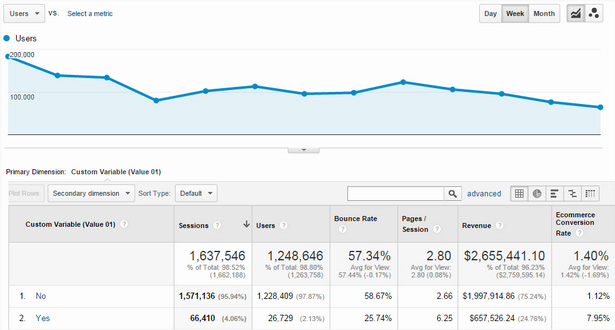
You can track spend against returning visitors in the Audience report in Google Analytics. Here, you’ll see the percentage of sessions from new and returning customers, as well as a percentage of transactions and the revenue and conversion rates for those groups.
Alternatively you can get it by contrasting two easily available metrics: divide the total number of customers placing more than one order in a given time period, by the total number of unique customers acquired during the same period.
Finally, if you want to get technical about it try dropping this script into your thankyou page postpurchase:
_setCustomVar() description:
_gaq.push([‘_setCustomVar’, index, name, value, opt_scope]);
That’s going to let GA tell the difference between new and returning customers, not just visitors.
And the ‘1 Metric To Rule Them All’…
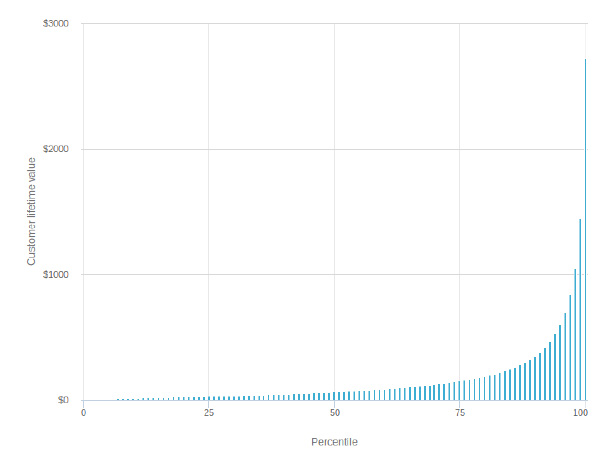
Customer Lifetime Value
Customer Lifetime Value (CLV), sometimes Lifetime Value (LTV), is probably the single most important metric there is. You can tell that because when you ask a bunch of people if they think it’s important they’ll all enthusiastically nod and agree. Then ask those same people how many of them religiously track CLV and listen to the awkward silence.
Why Does It Matter?
CLV is where it all comes together. High CLV customers are the backbone of your business. Low CLV customers cost a lot to acquire and don’t return much in profits. Tracking customer CLV shows you:
If you’re attracting the right traffic in the first place
If your conversions are based on ‘low hanging fruit’ like one-off deals or on solid interest in your products and brand
How effective your brand and storytelling are. Long-term, high CLV customers regard themselves as being a ‘X Brand’ person – effective branding should ‘click’ with people who share your values and want to espouse them by shopping with you. If it’s working, you should have the high CLV customers to show for it.
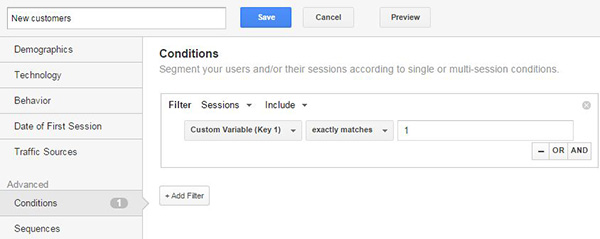
How Do I Track Customer Lifetime Value?
The simplest way to calculate average CLV within a segment is to multiply average profit per order, by average number of orders per customer.
Remember this?
_setCustomVar() description:
_gaq.push([‘_setCustomVar’, index, name, value, opt_scope]);
It has another job. With it, you can assess customer lifetime value more easily. Set Conditions so that new customers are measured when the number of orders is equal to 1:
Then set up the returning customers for order numbers greater than 1:
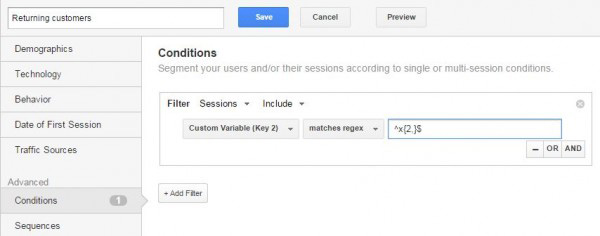
Now the Advanced Segment, Returning Customers, will show all customers with more than one order.
Conclusion
Tracking the right metrics gives you insight into the really critical parts of your business. It also gives you data you can use to plan for growth. What the fastest growing e-commerce business have in common is, they’re all tracking their vital metrics religiously, and basing every decision on them. Monitor the right metrics, base business decisions on them and your brand will grow.
About The Author:
Richard Bayston is a freelance blogger and copywriter covering tech, digital marketing and content strategy for SMBs. I’ve also been known to write on health and fitness. Find out more: Richard@RBCopywriting.com or @RBCopywriting. The rest of my time is spent arguing amicably with my wife and Googling the answers.
*Featured Image Source