
Google Analytics can be your best friend in e-commerce. It gives you a huge amount of information on your site and your customers, letting you trace where they come from, what they do and how they interact with your site. Winning at e-commerce means knowing your customers and tracking your performance, and Google Analytics is an awesome tool for that.
If you don’t already have a Google Analytics account, set one up: it’s quick and easy.
When your account is activated, you’ll need to enable tracking in order to take advantage of the tool to its fullest.
To do that, sign into your Google Analytics account, choose the account you want to enable tracking on (you can have more than one account inside your main account) and go to the Admin tab from the top navigation.
In the third column from the left, you’ll see e-commerce. Turn the toggle switch underneath it to ‘on.’
That’s the easy part.
The next step is to add tracking codes to your website.
You do that by adding this JavaScript tracking snippet to your site, before the closing </head> tag. The ‘UA-XXXXX-Y’ part should be replaced with the property ID you want to track.
<!– Google Analytics –>
<script>
(function(i,s,o,g,r,a,m){i[‘GoogleAnalyticsObject’]=r;i[r]=i[r]||function(){
(i[r].q=i[r].q||[]).push(arguments)},i[r].l=1*new Date();a=s.createElement(o),
m=s.getElementsByTagName(o)[0];a.async=1;a.src=g;m.parentNode.insertBefore(a,m)
})(window,document,’script’,’https://www.google-analytics.com/analytics.js’,’ga’);
ga(‘create’, ‘UA-XXXXX-Y’, ‘auto’);
ga(‘send’, ‘pageview’);
</script>
<!– End Google Analytics –>
To get deeper into it, go here. If this stuff looks scary get a developer to set it up, but it should be possible to just cut and paste the code, drop your ID in and get started.
Once you’ve got your Google Analytics account up and running and your site is feeding it information, what can you track with it?
Audience Demographics
Google Analytics lets you divide your traffic by demographics to figure out if particular demographic groups are serving your business better.
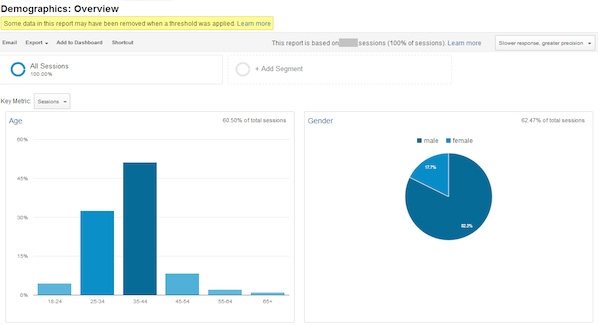
You can find Audience Demographics under Audience > Demographics, then select demographic features like Age.
If you use Data, you’ll see raw numbers. But use Comparison and you’ll get that demographic’s data compared against your site’s average.
You can dial in further: go to Secondary and you can section demographics by two criteria – age 55-65 and female, for instance.
Tracking traffic is cool. But tracking revenue is cooler. By default Google Analytics will track Sessions, but click that drop down and switch to Revenue and you can see which of those two-criteria demographic segments are paying you the most!
This comes with two major advantages. First, it lets you serve your best customers better. The more you know about them, the more you can tailor your content, offers, and even products to their needs. Second, it lets you find ‘look-alikes’ in your unconverted traffic.
Suppose your best customers are men, aged 35 to 45. You know that you stand to gain by carefully targeting 35-45-year-old men visitors and making extra efforts to convert them.
Advanced Segments
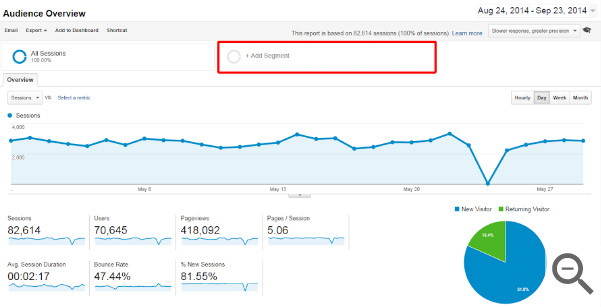
Google Analytics Advanced Segments lets you gain valuable insights about your users. Find Advanced Segments in the dropdown next to the default All Visits view.
Here’s how to get the best out of them:
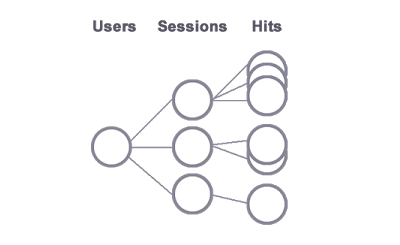
Users, Sessions and Hits
Advanced Segments are categorized by Users, Sessions and Hits. User segments out the data by users. So if you created a User segment with a ‘Revenue’ metric, looking for users who have generated over $100 in revenue, GA would show you users who spent that in one visit, several visits, total lifetime value – it’s the user, not any of their behaviors, that gets tagged.
Visit segments data by visit or session. Create a Visit segment for that same $100 revenue metric, you’ll see each session that resulted in $100.
Hit segments out user interactions during a session. That means pageviews, events and transactions as well as any other interaction. A single user can have multiple sessions, with multiple hits in each session.
Segment Builder
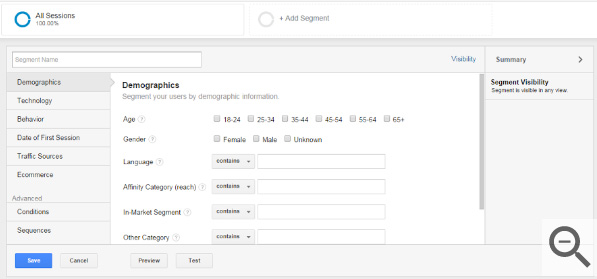
The Segment Builder tool lets you build your own using a dimension or metric, a comparative operator (like ‘exactly matches’) and a value. For example, you can build segments that identify groups based on the language used or revenue.
Creating Cohorts
A cohort is a group of users that all share a common characteristic and all share a date condition of some sort. For instance, you could look at users who first visited in January this year. What have they done since then?
You can create cohorts based on first visit or other date criteria.
Segments Import
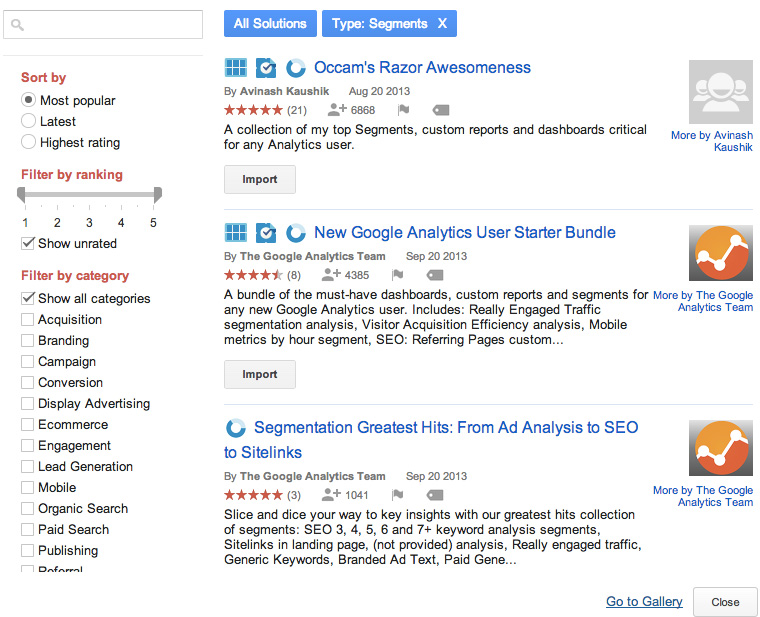
GA has 22 ready-made segments and you can build your own. But if off the peg doesn’t fit and you’re not quite ready for bespoke, then you can use the ‘Import from Gallery’ button to import segments that have been created both by the GA team and by other users.
It’s worth looking in the Google Analytics Solutions Gallery before you create a segment – the one you’re looking for probably already exists and simply importing it could save you some time.
Mobile Optimization
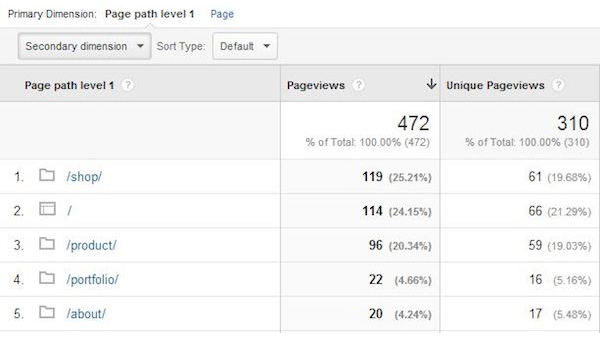
Optimizing for mobile is table stakes in e-commerce now. GA provides you with a way to find which pages are performing better or worse for mobile. Go to Behavior > Behavior Flow > Site Content > Content Drilldown, and add a Secondary Dimension of Device Category.
Then apply an Advanced Filter, and use a mobile performance metric. For instance, check individual page bounce rate against the site average. If your average bounce is 20% – that’s pretty good for e-commerce – try looking for ‘bounce rate is over 40%’ and gradually dialing it down. Add in Device Category Containing Mobile and you’ll get a page-by-page high mobile bounce rate.
You can specify pageviews too – like checking out pages with low views to see if they also have a high bounce rate, or search pages with over 50 views – or over 1000 – to see if high-view pages have high bounce rates.
Finally, if your site architecture is up to snuff, you can apply a Page Level Category 1 filter and filter out everything except product and category pages.
Checkout Optimization
GA is with you the whole way through the funnel. You can analyze the traffic to your checkout separately using the Checkout Behavior Analysis report under Conversions > E-commerce > Shopping Analysis in GA.
This lets you look at your checkout process and figure out where leaks are occurring, because you can view it stage by stage. Checkouts are one of the leakiest parts of the e-commerce funnel. In most e-commerce stores cart abandonment is way higher than bounce. And the visitors you lose here are more important – if someone walks away in the middle of the checkout process, they’ve amply demonstrated purchase intent and then left anyway.
Some of this ties into mobile optimization. Here’s Sid Barath, over at LemonStand, talking about an e-commerce transaction he witnessed:
The “Add to Cart” page was terrible. It was like the e-commerce platform that this store was running on had just given up on pretending to be responsive. Our valiant heroine struggled briefly with this page, but she eventually found the “Continue to Checkout” button.
And that’s when the horror began. The checkout page was the digital equivalency of anarchy. The entire desktop view tried to render itself within the limited dimensions of the mobile screen. Form fields were warring with each other, vying to be the first to get filled out.
This was too much even for our heroine. She visibly flinched and shut the app. Another customer abandons her cart, another checkout funnel leaks sales, and another e-commerce owner wonders why people aren’t buying.’
That’s cool for Sid. But unless you’re going to hang around on buses, looking over people’s shoulders, you need a better way to find out where in the checkout process your users quit.
Google Analytics will show you a page-by-page breakdown of exactly where your users exited your site. Then you can use that knowledge to optimize the checkout portion of your funnel, cutting down on purchase friction and slashing cart abandonment.
Screen Optimization
Google Analytics lets you find out which screen resolutions your site isn’t optimized for. These are the screens that will probably be clicking away from you. To find this information, navigate to Audience > Technology > Browser and OS. Then select Screen Resolution as your Primary Dimension.
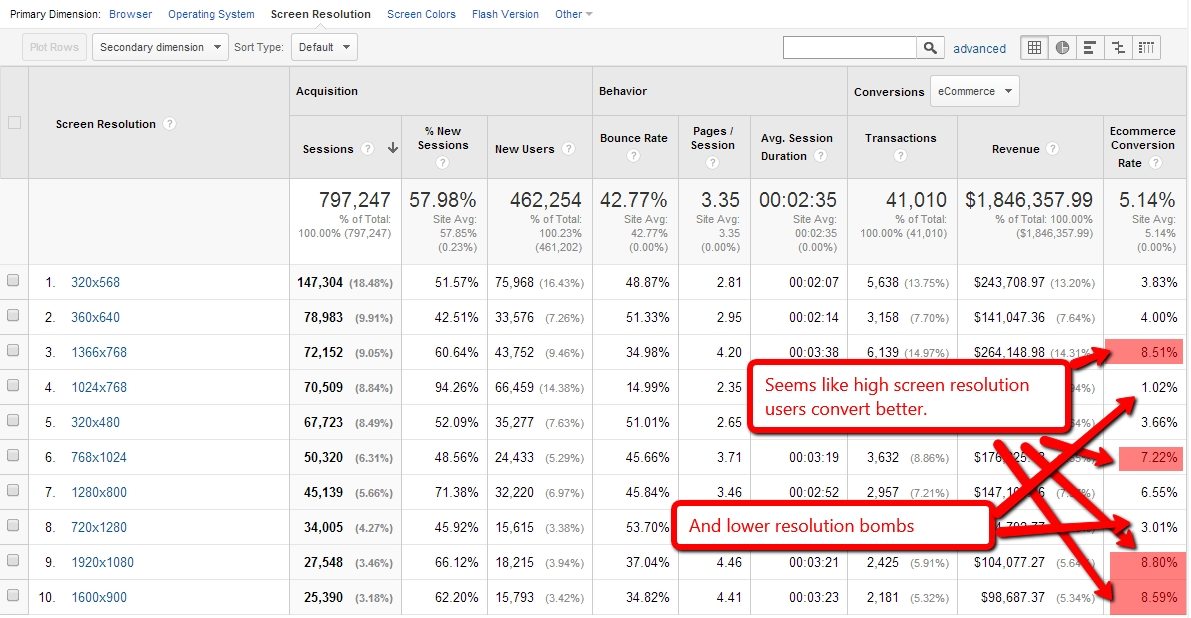
You can use Operating System as a Secondary Dimension. Filter the results by Bounce Rate to see the screen resolution and OS of users who bounce.
What you’re hunting here is devices that have a traffic profile that stands out. So if you’ve got conversion rates in the 1% range across all screen sizes, you’re not going to necessarily fix that by addressing screen size optimization. It might help, but you can’t draw that conclusion from that data. If you’ve got 2% conversion everywhere else and 1% on screens under 320px width, you know you need to serve those screen dimensions better.
Site Search Optimization
If you’re Dollar Shave Club, your site search function isn’t going to see all that much action because the range of goods on offer is so small. But for some e-commerce sites with thousands of pages, site search is vital. Shoppers will arrive on product pages from a range of different sources including category pages, click-through from the homepage via featured product menus or popups, and search, social and direct links. But they’re also going to get there by searching your site.
Many site search functions work way, way worse than Google. Some will fail to show products when you search within the site, but show those same products when you search the site using Google. But you’re not going to make much margin selling to the stubborn and tech-savvy. Your site search should be fast, easy to use and always show all your products.
How can you use Google Analytics to track the effectiveness of your site search function?
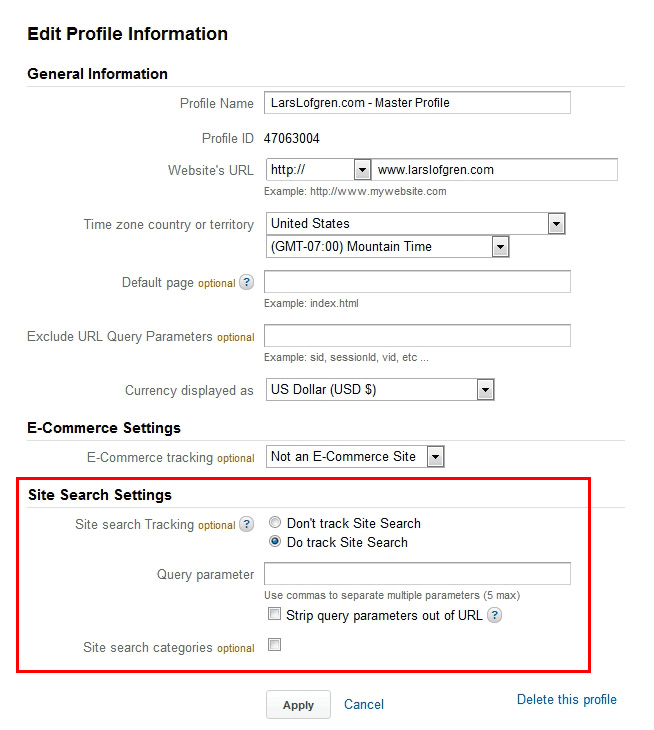
First of all, site search has to be enabled, and you have to set the ‘search query parameter’ in Admin. To do that, navigate to Admin>View Settings, then enter your query parameter.
Then check out your GA reports under Behavior > Site Search > Search Terms.
Interpreting the Results:
Use ‘Total Unique Searches’ to view the most popular searches, ranked. That’s valuable data – do you stock the products people come to your store looking for?
Check out ‘Average Search Depth’ in the top 10 to 20 results for Total Unique Searches. That’s Search Depth divided by Total Unique Searches. It shows the average number of pages a visitor viewed after using your site’s internal search engine. High numbers indicate visitors who are engaged with search results – they found a lot of things they wanted to look at. Low numbers indicate users whose search results weren’t helpful, and who didn’t engage with them.
Time After Search data will show you the session length after a user searches. Contrast this with Search Depth: High Depth, low Time is a user scrolling through a bunch of search results, then bailing. High Time, high Depth, you’ve got high engagement, indicating good, appropriate search results.
Check out the e-commerce link on the Explorer tab. Here, you’ll find details of total revenue from internal search queries, as well as average order value, letting you treat internal searchers as a revenue segment and compare them with traffic from external search, email, social, direct and other sources.
Behavior Flow Reports
Behavior Flow Reports show your audience behavior data as a flowchart, visualizing the data for you so you can see it as a process, not just a column of figures. That’s awesome, right?
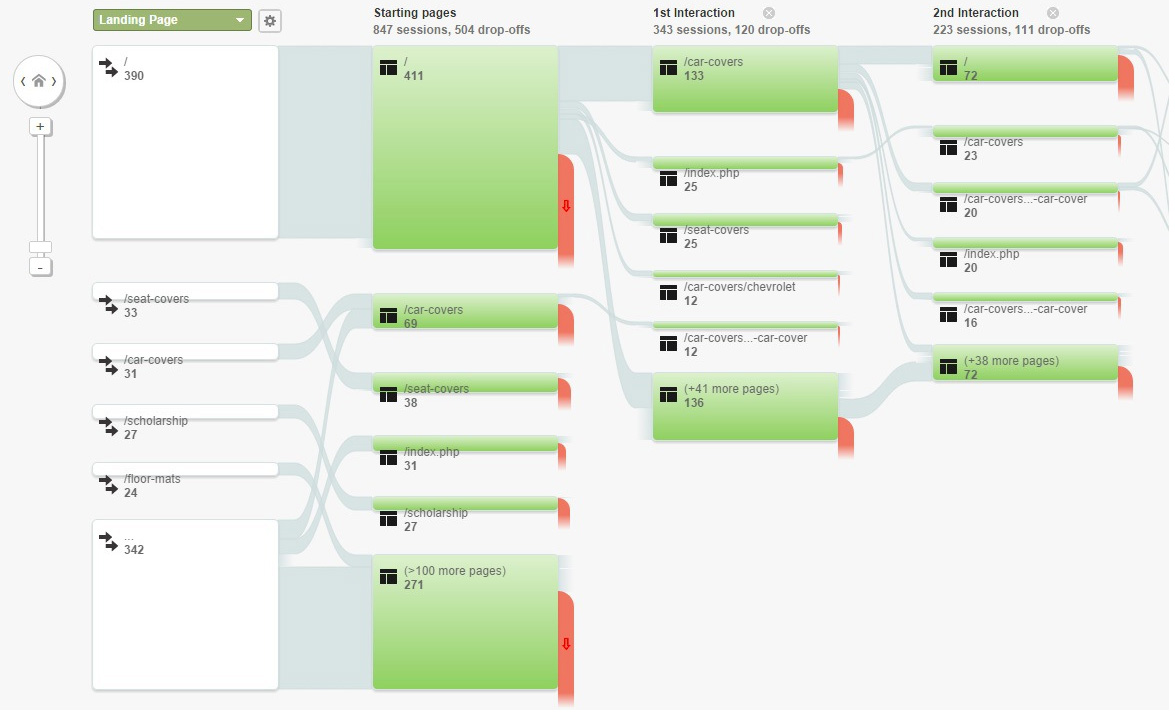
Well yes, it is actually. Except if you feed everything you have into that, you’ll get a result that looks like a plate of spaghetti.
The best approach is to use Advanced Segments to feed your Behavior Flow Report, so you can analyze a discrete group of data and not just wind up bewildered.
Start by going to Behavior > Behavior Flow, and hovering over any page. You’ll be offered three choices:
- Highlight Traffic Through Here. This will highlight the five most popular pages after the one you selected.
- Explore Traffic Through Here. This resets the flow’s starting point, which is your homepage by default, and instead makes it begin from the page you’ve selected. Then it will reveal the next three steps in the flow through the site.
- Group Details. This generates a table based on the data of the most popular pages after the page you’ve selected.
In-Page Analytics
In page analytics lets you track what’s happening right on individual pages of your site. After all, there’s more than one asset on a page, so what’s responsible for metrics like bounce or conversions? How do you know which elements of that page are winners for your company?
In Page Analytics lets you visualize that data so you can look at it and answer questions like:
- Are users seeing the content you want them to see?
- Are they finding what they’re looking for on the page?
- Are your CTAs effective – do people see them and respond to them?
- Which links are users clicking?
In Page will let you zoom in on an area you’ve previously identified as a problem and see exactly which element of the web page is linked to the issue. Knowing all that and tracking it allows you to A/B test the individual elements of a webpage and track the results in GA to figure out how to drive up conversions and serve your customers better.
Find In Page Analytics under Behavior > In Page Analytics, and use it with Advanced Segments for the best results.
Unified Customer Tracking
Tracking traffic is cool. It gives you a view of what’s happening and what your customers are doing on your site. But it can be a cloudy, confused view if you don’t sort out unified customer tracking.
Here’s the problem: Michael, let’s say, comes to your site on mobile. He puts some items in a cart, searches your site – and leaves, as 97% of your mobile visitors probably will. Later on at home, he comes back to your site, puts something else in the cart, and leaves again. Finally, on a tablet a couple of days later, he’ll actually make a purchase.
If you’re tracking traffic and not customers, Michael’s three visits on three different devices will show up as three different people in all your Google Analytics data. You’ll get artificially inflated cart abandonment stats, you’ll get inaccurate ideas about which platforms work for your e-commerce site and you won’t know for sure what Michael – or anyone else – really thought of your site.
What you need is a way to track the same user across multiple devices. Once again, Google Analytics has you covered.
Client ID and User ID
Client ID is the unique ID that Google generates from a device and web browser combination, and it’s regenerated every time a new device is used and even when a user deletes their cookies. It’s this identification of a shopper with their device that we need to get away from so we can track people, not devices.
Step forward Client ID.
User ID is the information a shopper sends to Google Analytics automatically that ‘authenticates’ them as a shopper on your website. User ID lets you create and assign you own IDs to track specific users, meaning you’re watching people, not browsers or devices, and your analytics is much more reliable.
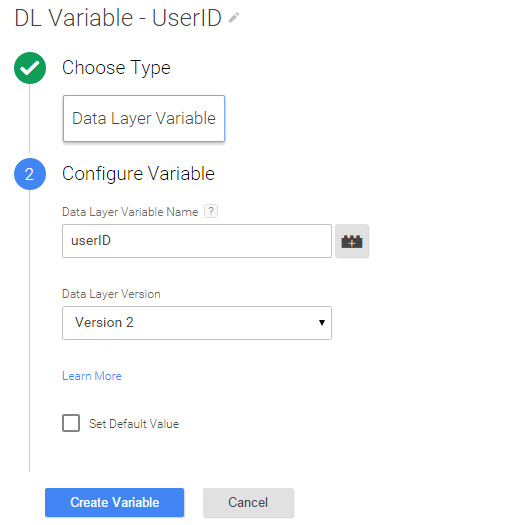
First, you’ll need a source of user IDs. Customer login data is absolutely perfect for this. Then you’ll need to set up GA to accept this kind of tracking, which can be done in the Admin panel, under Property > Tracking > User-ID.
You’ll also need to set up Google Tags Manager, creating a variable for the User-ID value – essentially, telling GA that it exists and needs to be tracked. Create a DL (Data Layer) Variable:
Benchmarks
So you have all this data, and you can use it to build up a picture of how every aspect of your site is performing. What you don’t have yet, is a benchmark: an idea of how that picture ought to look. You’re seeing 1% conversions – is that good, bad, average? Without benchmarks you don’t know. Benchmarks let you see where you are compared to the average and give you some insight into what your competitors are doing too.
To set up benchmarking in Google Analytics, head over to Admin > Account Settings, and scroll down to tick the Benchmarking box.
From this point, you can set up different benchmarks to compare your site’s performance.
Historical Benchmarks
Historical benchmarks compare your site’s performance to past years, quarters, months or weeks. Set them up by going to the Acquisition section of the Reporting tab, then select All Traffic > Channels. Go to the calendar and select a date range, and check the Compare To box and select ‘Previous Year.’
Industry Benchmarks
Industry benchmarks let you assess the effects of your marketing by showing you what the average is across the industry. If most sites see traffic dipping in January but yours rises, what are you doing differently? Are you getting more traffic from certain states, or countries, than the norm?
Benchmarks Cover Three Main Areas:
- Traffic Sources
- Location and Device
- Additional Metrics: sessions, percentage of new sessions, new sessions, pages per session, average session duration, and bounce rate.
Where Can You See Benchmark Reports?
You’ll need to enable data sharing in your GA account to view these. You’ll find them under a new Benchmarking option in the Audience section, and they’ll display three different reports: Channels, Locations and Devices. You’ll also find filtering options including Industry Vertical, Country/Region, Size by Daily Session, Benchmark Group Size, and Benchmark Metrics to Chart which offers a range of metrics to be shown in the chart.
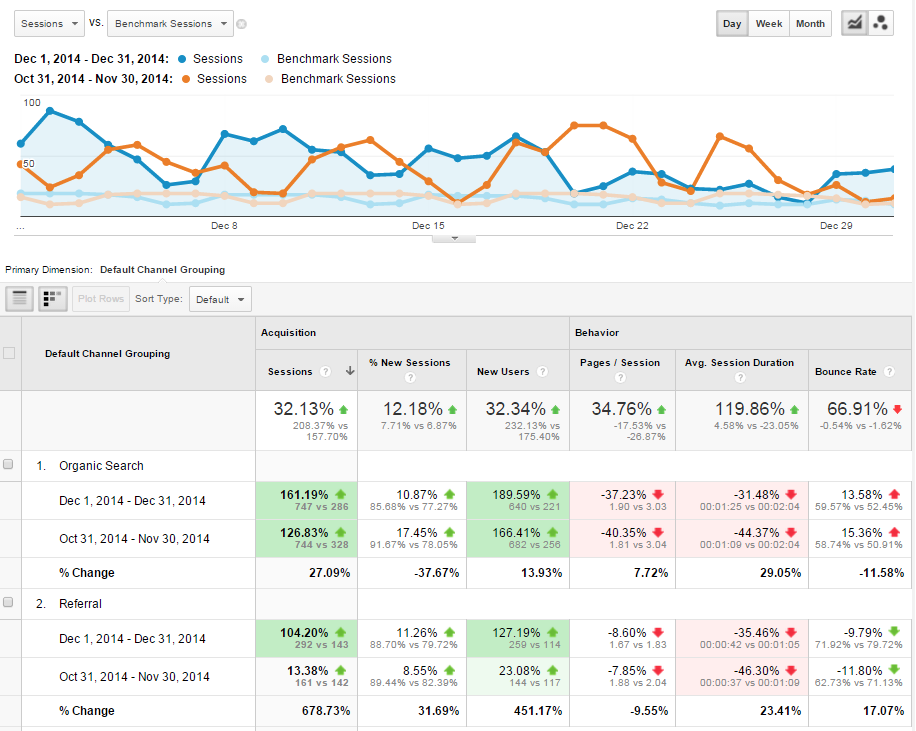
When you view the reports, you can also use the icons above the chart to enable automatic color coding. This flags the key areas where you’re overperforming or underperforming compared with the benchmark.
Conclusion
At first glance, Google Analytics seems intimidating and confusing. But once you set it up right, GA delivers incredible insights. And those insights can fuel changes in content, marketing and funnel design, allowing you to drive up conversions and serve your customers better.
About The Author:
Richard Bayston is a freelance blogger and copywriter covering tech, digital marketing and content strategy for SMBs. I’ve also been known to write on health and fitness. Find out more: Richard@RBCopywriting.com or @RBCopywriting. The rest of my time is spent arguing amicably with my wife and Googling the answers.
*Featured Image Source