
Each week, we publish a mishmash of ecommerce related, insight infused articles for you to smash through. Just as we collect business information across all of a merchant’s channels in a single place, we’re doing the same for ecommerce related content from a variety of top tier content creators.
If you find the material filling your appetite for knowledge, feel free to share this post, as well as any article you see here. This week we’ve got industry stats for days. Whether in the form of a chart or a line graph, it’s data on a hodgepodge of topics like holiday performance predictions, ecommerce device usage, cart abandonment, and email marketing. But they’ve all got one thing in common – percentages to give you an idea of what’s going on in the industry.
Our Holiday Hopes
While some holiday ecommerce estimations are a little hesitant to claim 2015 will outperform last year, Adobe is planning for the best. Marketing Land reports on Adobe’s holiday shopping predictions, which claim an 11% year-over-year boost, with Thanksgiving sparking a week’s worth of selling. Interestingly, they plan for Thanksgiving as opposed to Black Friday or Cyber Monday to grow the most this year at 18%. It wouldn’t be a surprise to see consumers purchasing from their mobile devices on Thanksgiving in the comfort of their homes, prompted by the terrifying image of Black Friday crowds that lurks in the back of their minds.
How Do the Devices Rank
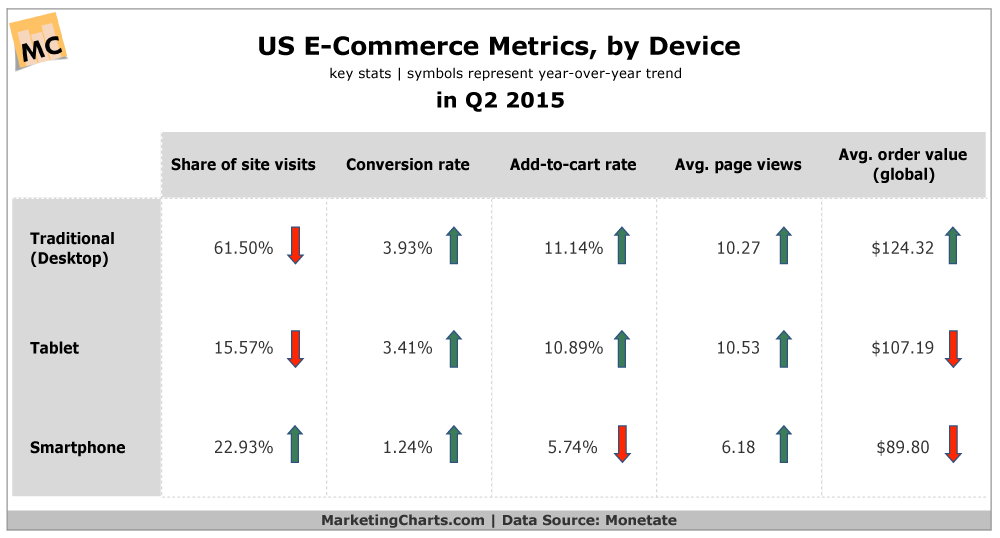
Speaking of mobile devices, Monetate collected data on a variety of ecommerce metrics by device to see each’s effects on the industry during Q2. Thanks to Marketing Charts, we’ve got a table below for you to put your eyes on. Whether it’s news to you or not, smartphones are driving significant amounts of site visits, but their conversion rates aren’t as hot as your standard desktop or tablet, likely because so many consumers use their phones to research products. Also, although device habits are shifting toward mobile, desktops are still the reigning champs of order value.
Why Stroll When You Can Scroll
According to Deloitte’s annual holiday sales forecast, digital channels, that is computes and mobile devices, will account for 64% of all holiday purchases. It’s no surprise that more and more consumers are headed to ecommerce for the holiday selling (who wants to deal with the holiday crowds?), but mobile and online engagement are contributing significantly to both online and B&M storefronts, with consumers hopping from channel to channel as they travel down the purchase process. Deloitte’s research also suggests that 80% of shoppers connect with a brand via digital channels prior to even heading to a store.
To Abandon All Hope
Cart abandonment is a serious deal when it comes to ecommerce that’s unavoidable in some situations. In fact, eMarketer’s analysis of multiple surveys and studies on cart abandonment seems to show that a chunk of abandoners are willing to put an interesting product in the checkout basket, but interesting isn’t quite enough to buy (28%). In some situations, consumers want to do some additional research before committing those credit card digits (27%), but price also remains a abandonment motivator at 19%. It’s also reported by HookLogic that home goods tend to be the most abandoned products (29%), with home and beauty, as well as electronics right behind.
Rating Rates
Curious to see email marketing metrics by other businesses? Check out MailerMailer’s report analyzing the open and click through rates of nearly 1.2 billion opt-in newsletters. Naturally, there’s a ton of information for you to sift through here, but an interesting point suggests that while open rates have gone up over the past few years, click through rates are trending downwards, highlighting the huge importance of engagement. But while this is a good snapshot of rates from a huge variety of business, it’s important to take it with a grain of salt – every email list is different!